Statistics
OpenvCloud integrates with Grafana for data visualization, and uses InfluxDB for storing all aggregated data gathered through Redis from various sources. See How statistics are gathered for more details.
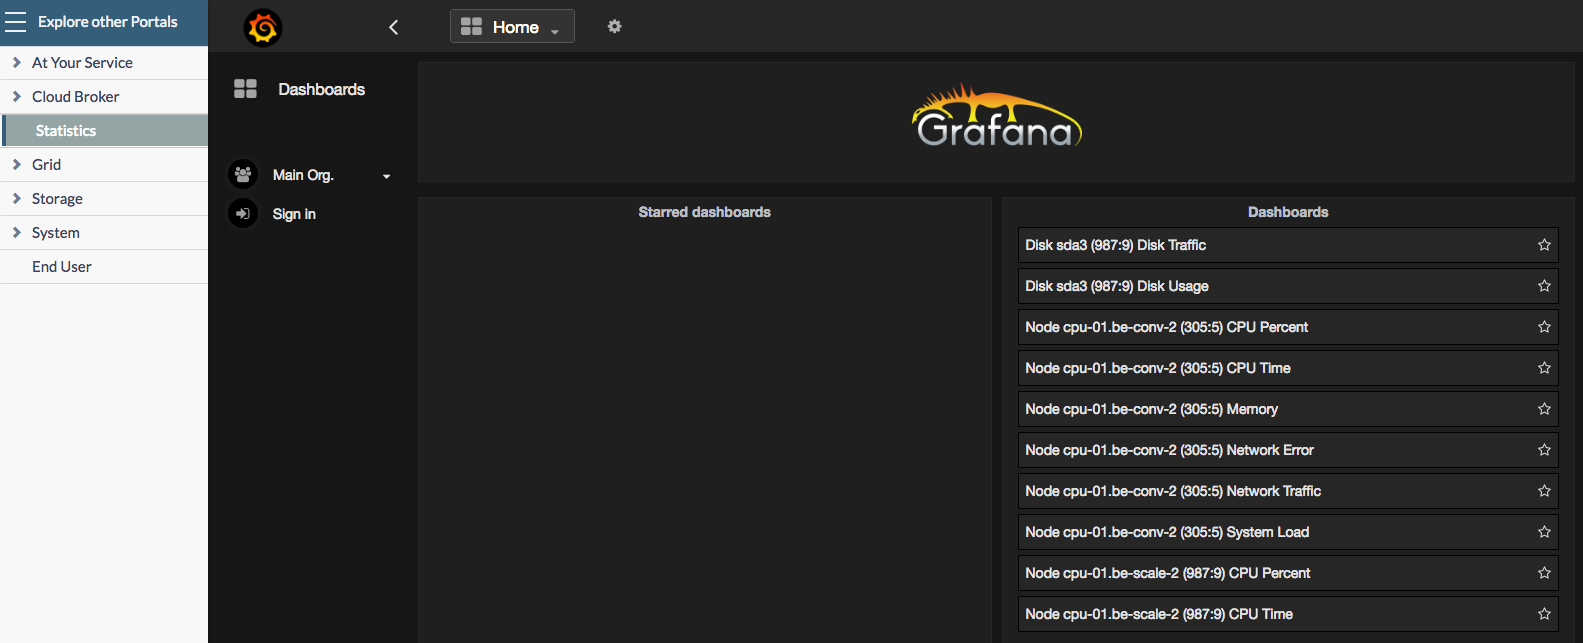
Actual visualization is done via Grafana Dashboards which are available in the Operator Portal under Statistics:
Overall System Performance
The Cloud Broker Operator Portal comes out of the box with the Overall System Performance dashboard consisting of following panels:
- Total IOPS
- CPU Utilization
- CPU Percentage
- Available Memory
- Receive/Transmit (Rx/Tx)
- Context Switches
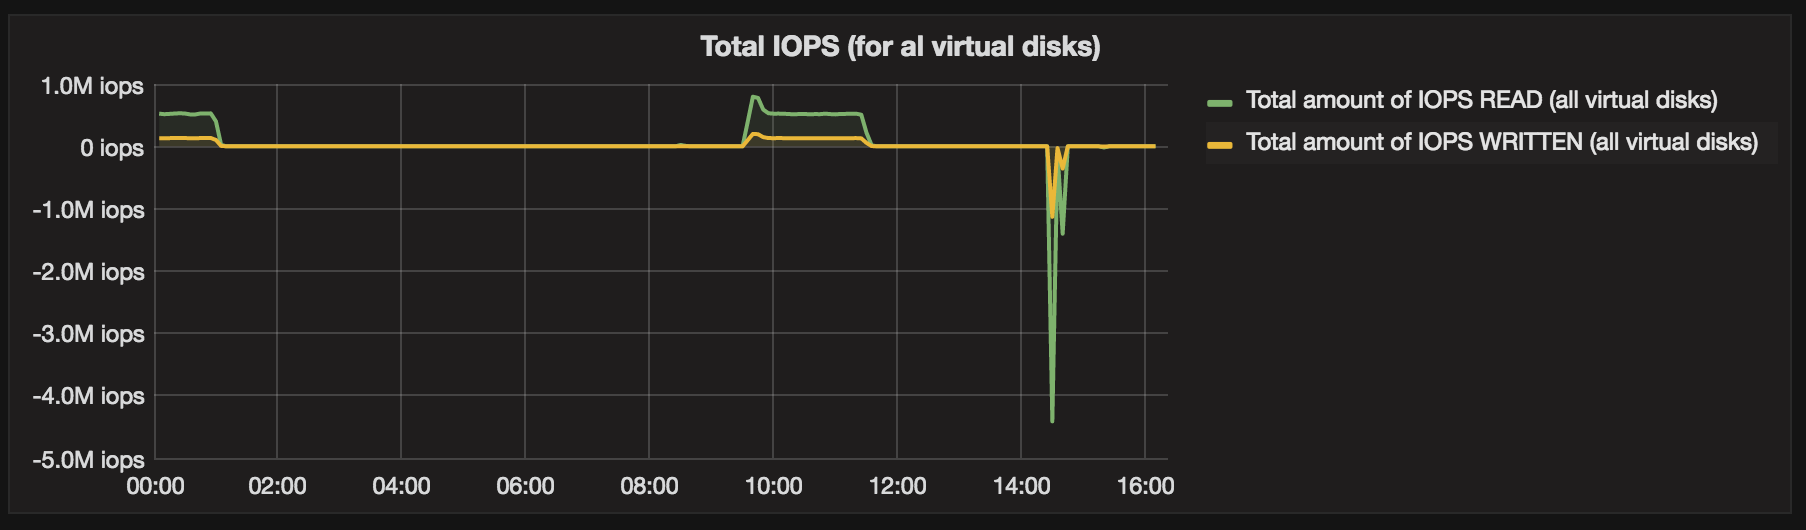
Total IOPS
This panel show the total READ and WRITE IOPS of all virtual disks combined.
- Panel type: Graph
- Panel data source: influxdb_controller
- Metrics:
- Query A, Total amount of IOPS READ:
- FROM disk.iops.read|m WHERE type = virtual
- SELECT field(value) sum()
- GROUP BY time(auto)
- Query B, Total amount of IOPS WRITE:
- FROM disk.iops.write|m WHERE type = virtual
- SELECT field(value) sum()
- GROUP BY time(auto)
- Query A, Total amount of IOPS READ:
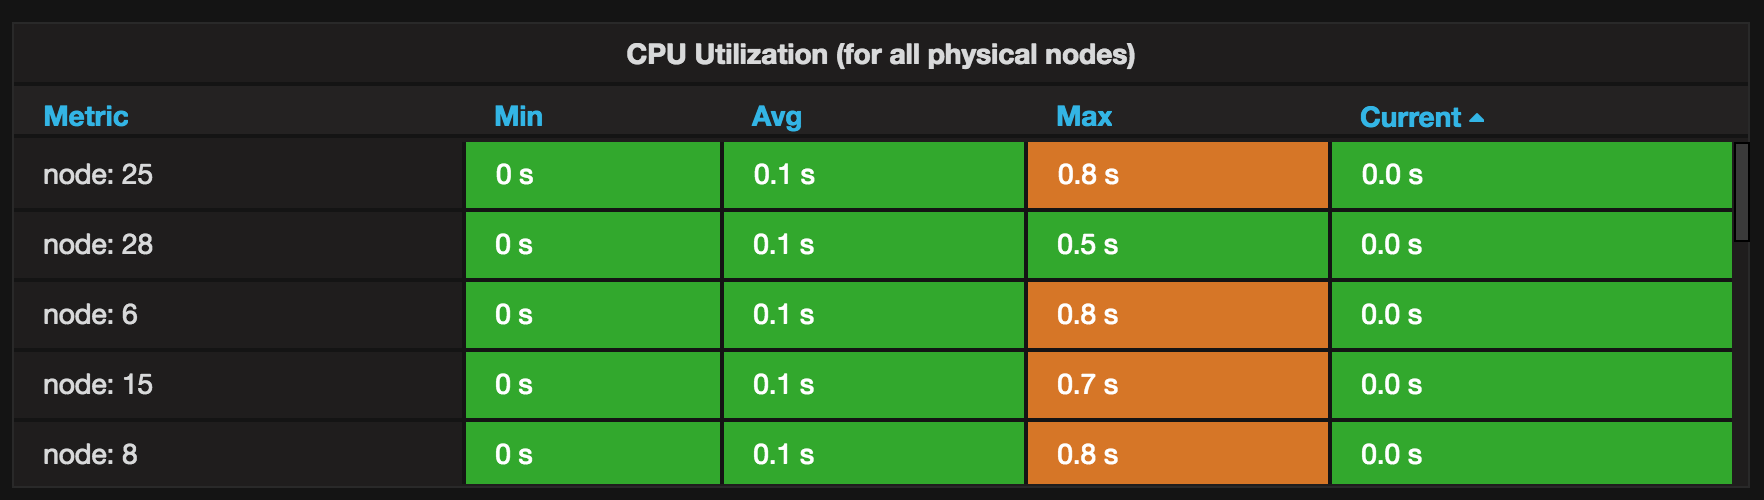
CPU Utilization
The first panel shows the average, minimum and maximum CPU time for all physical nodes:
- Panel type: Graph
- Panel data source: influxdb_controller
- Metrics:
- Queries A, Average CPU utilization (all physical nodes):
- FROM default machine.CPU.utilization|m WHERE type = physical
- SELECT field(value) mean()
- Queries B, Minimum CPU utilization (all physical nodes):
- FROM default machine.CPU.utilization|m WHERE type = physical
- SELECT field(value) min()
- Queries C, Maximum CPU utilization (all physical nodes):
- FROM default machine.CPU.utilization|m WHERE type = physical
- SELECT field(value) max()
- Queries A, Average CPU utilization (all physical nodes):
The second panel shows the minimum, average, maximum and current CPU time for each physical node:

- Panel type: Table
- Panel data source: influxdb_controller
- Metrics:
- Query A:
- FROM machine.CPU.utilization|m WHERE type = physical
- SELECT field(value)
- GROUP BY tag(nid)
- ALIAS BY: node: $tag_nid
- Query A:
- Options:
- To Table Transform: Time series to aggregations
- Columns: Min, Avg, Max, Current
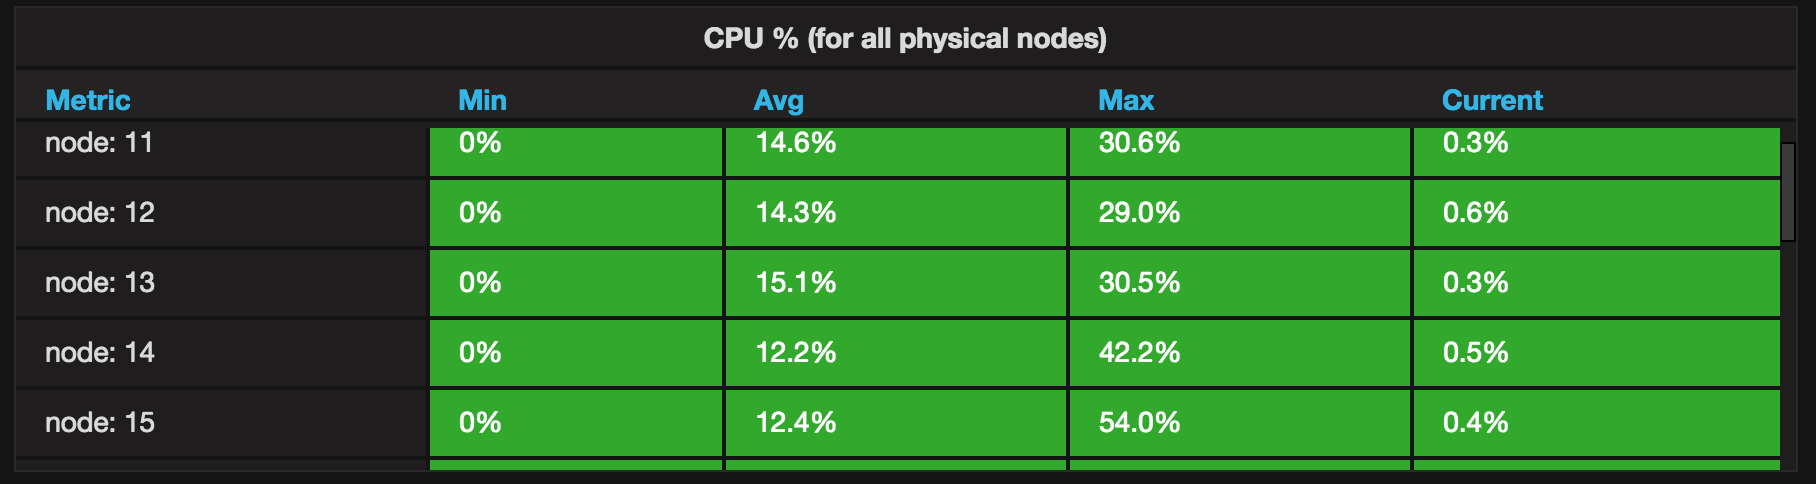
CPU Percentage
The first panel shows the average, minimum and maximum CPU percentage for all physical nodes:

The second panel shows the minimum, average, maximum and current CPU percentage for each physical node:
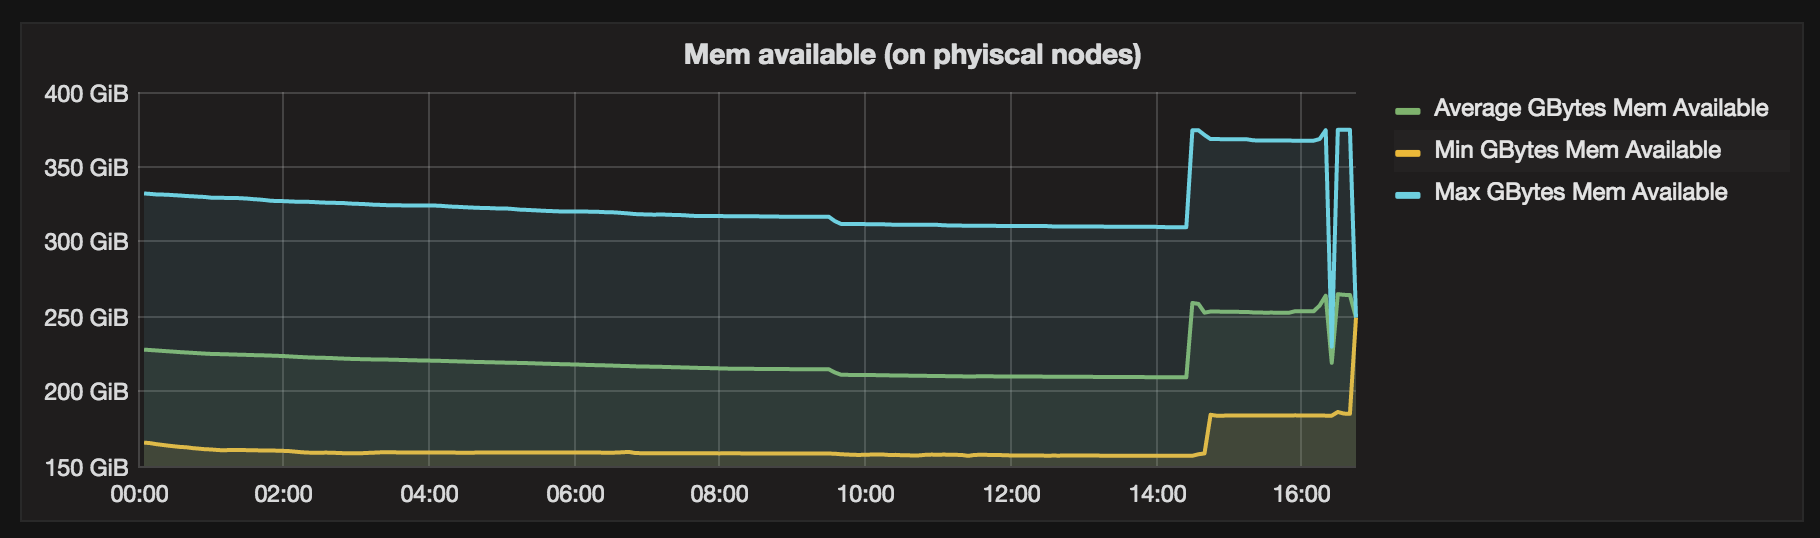
Available Memory
The first panel shows the average, minimum and maximum amount of available memory for all physical nodes:
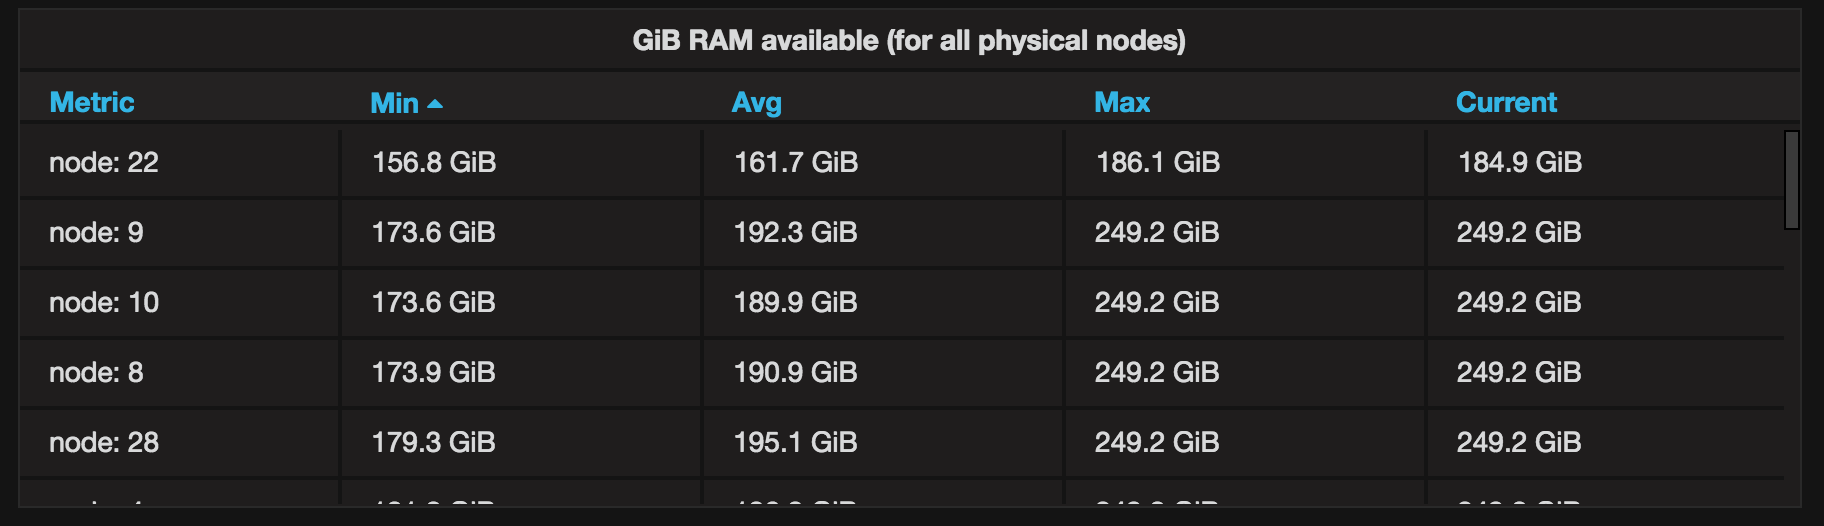
The second panel shows the minimum, average, maximum and current amount of available memory of each physical node:
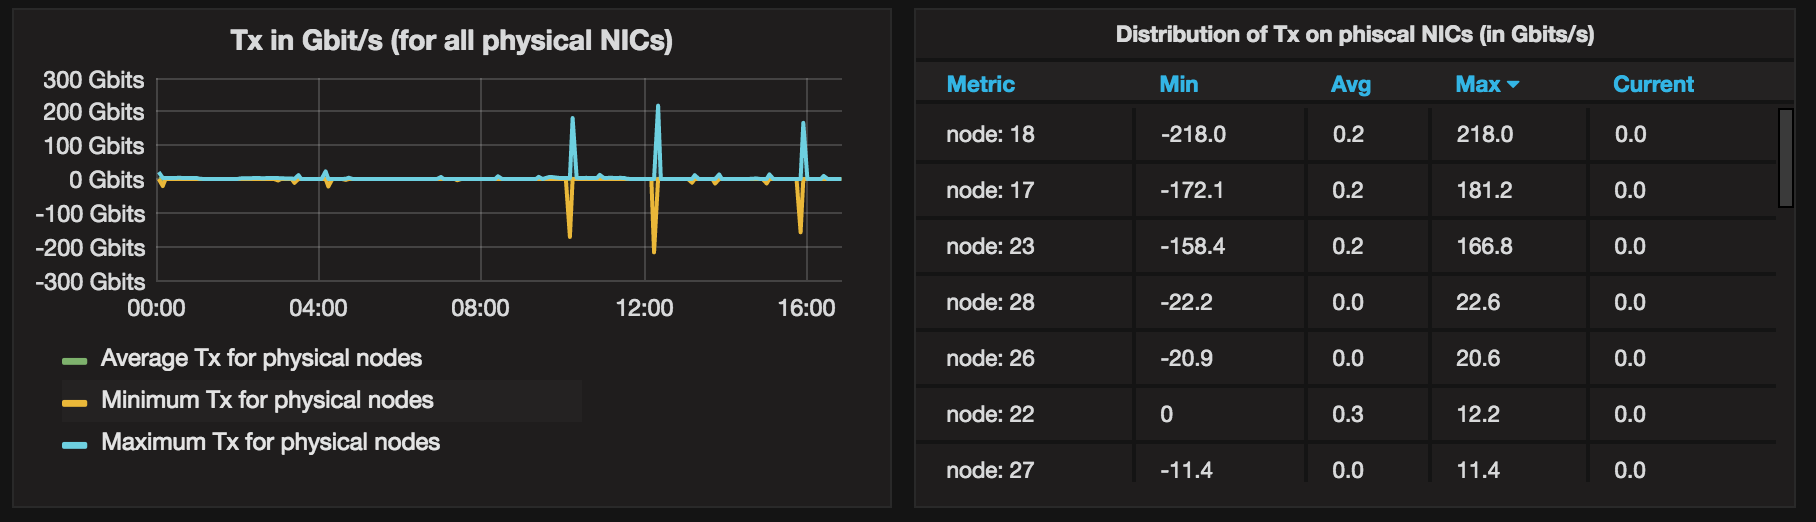
Receive/Transmit (Rx/Tx)
The first panel shows the average, minimum and maximum amount of received data for all physical nodes, and the details per physical node:

The second panel shows shows the average, minimum and maximum amount of transmitted data for all physical nodes, and the details per physical node:
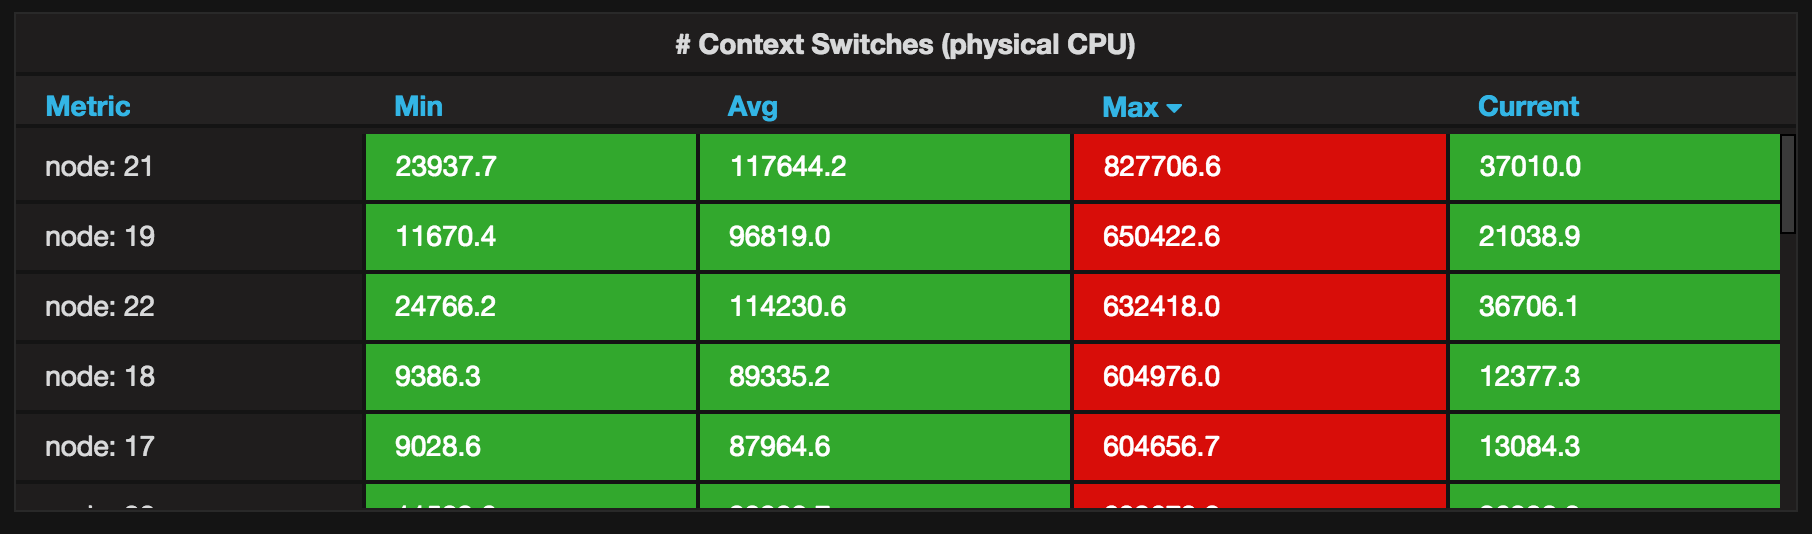
Context Switches
The first panel shows the average, minimum and maximum amount of context switches for all physical nodes:

The second panel shows the minimum, average, maximum and current amount of context switches of each physical node: