Create Custom Dashboards
If you are completely new to Grafana, start here: http://docs.grafana.org/guides/gettingstarted/
Following measurements are available:
- disk.iops.read
- disk.iops.write
- disk.throughput.read
- disk.throughput.write
- machine.CPU.utilisation
- network.packages.rx
- network.packages.tx
- network.throughput.incoming
- network.throughput.outgoing
- network.vfw.packets.rx
- network.vfw.packets.tx
- network.vfw.throughput.incoming
- network.vfw.throughput.outgoing
For each of them three variants exist:
- h: values collected per hour
- m: values collected per 5 minutes
- t: total aggregated value
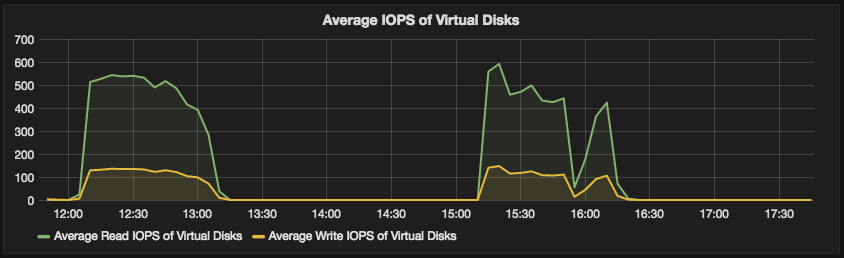
In what follows all steps are documented in order to create a simple dashboard visualizing the average read and write IOPS of all virtual machines.
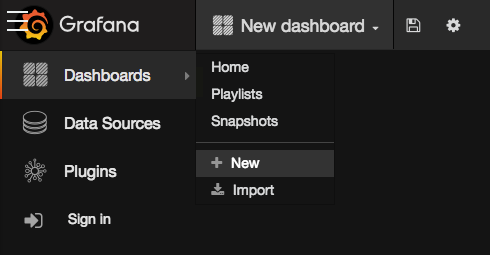
The very first step is selecting + New from the Dashboard menu:
You'll get an empty dashboard, with one row.
From the hamburger menu on the left of the row select Add Panel > Graph:

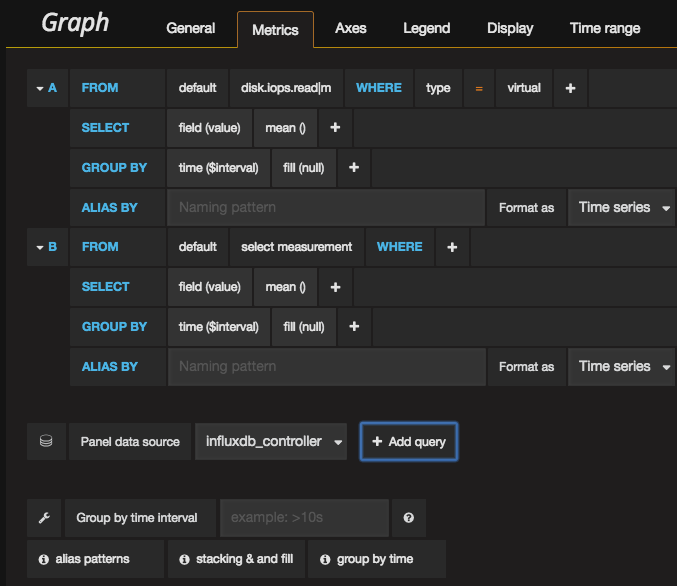
On Metrics tab of the Graph panel select Influxdb_controller as the value for Panel data source:

Still in the Metrics tab select disk.iops.read as the measurement of the first query:

Next specify that you only want the values of the virtual disks:

Add a second query by clicking + Add query:
For the second query select disk.iops.write as the measurement, and again for the virtual disks:
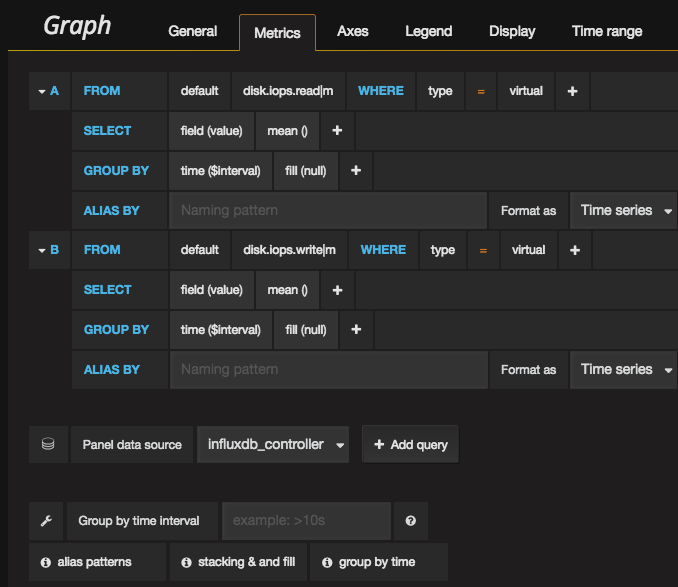
Change the aliases of both queries:

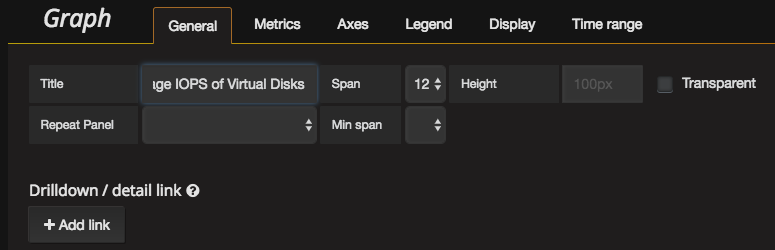
In the General tab change the Title to Average IOPS of Virtual Disks:
Hit Save and see the result: