Monitor the System Health
The system health is monitored using a collection of JumpScripts, maintained in a private 0-complexity/selfhealing GitHub repository. Check this private repository in order to get a current view on all JumpScripts. Below is just a snapshot in time.
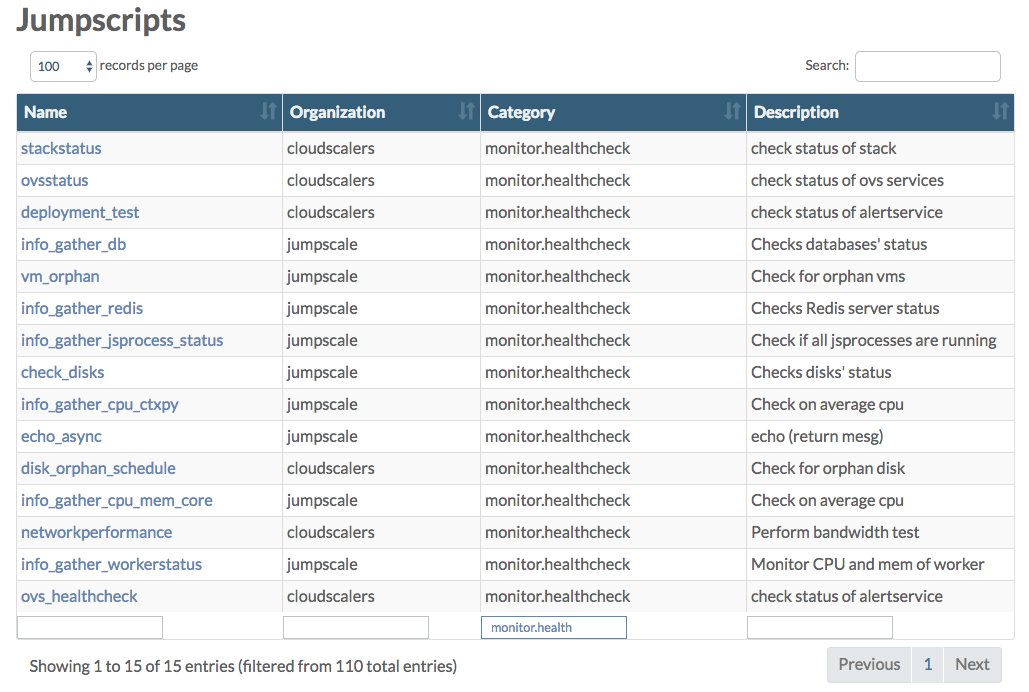
Also check the JumpScript page in the Grid Portal where you can filter on monitor.health to see a list of the JumpScripts actually available on your environment:
In order to check the actual system health go to the Status Overview page in the Grid Portal, also reachable by clicking the green, orange or red colored bullet in the top navigation bar:
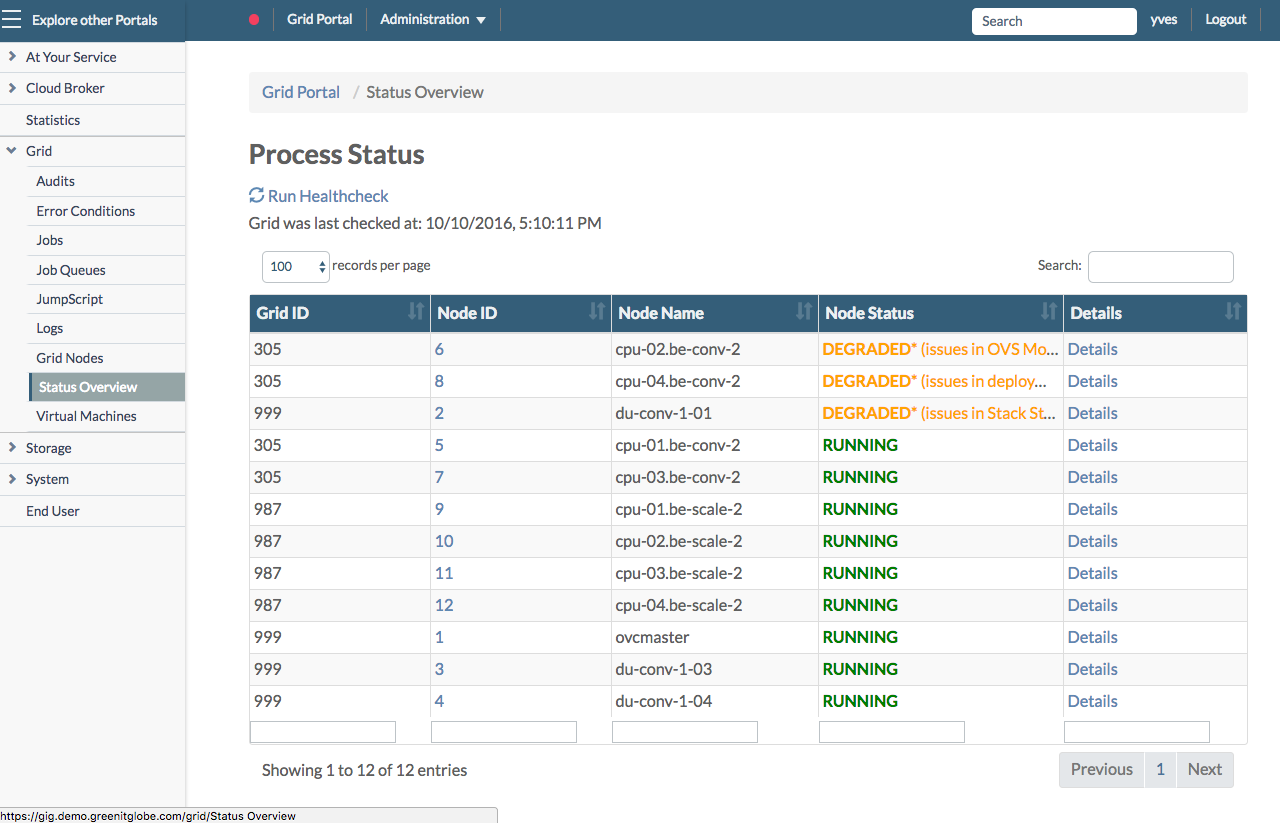
For more information about the Status Overview page go to the dedicated section here.
In what follows you get overview of all JumpScripts, organized in the same way (sections) as on the Node Status page.
Depending on the type of node, following sections are available:
| Section | Master Node | CPU Node | Storage Node |
|---|---|---|---|
| AYS Process | X | X | X |
| Databases | X | ||
| Disks | X | X | X |
| JSAgent | X | X | X |
| Network | X | ||
| Orphanage | X | X | |
| Redis | X | X | X |
| System Load | X | X | X |
| Temperature | X | X | X |
| Workers | X | X | X |
| Hardware | X | X | |
| Node Status | X | X | |
| Deployment Test | X | ||
| OVS Services | X |
AYS Process
- ays_process_check.py checks if all AYS processes are running. Throws an error condition for each process that is not running
System Load
- cpu_ctxpy_check.py checks the number of CPU context switches per second. If higher than expected an error condition is thrown
- cpu_interrupts_check.py checks the number of interrupts per second. If higher than expected an error condition is thrown
- cpu_mem_core_check.py checks memory and CPU usage/load. If average per hour is higher than expected an error condition is thrown
- openfd_check.py checks the number of open file descriptors for each process
- swap_used_check.py checks the amount of swap used by the system
- threads_check.py checks the number of threads, and throw an error if higher than expected
Databases
- db_check.py checks status of MongoDB and InfluxDB databases on Master. If not running an error condition is thrown.
Orphanage
- disk_orphan.py checks for orphan disks on volume driver nodes. Generates warning if orphan disks exist on the specified volumes. Is scheduled by disk_orphan_schedule.py, running on the master. Throws an error condition for each orphan disk found
- vm_orphan.py checks if libvirt still has VMs that are not known by the system
Disks
- disk_usage_check.py checks status of all physical disks and partitions on all nodes, reporting back the free disk space on mount points. Throws error condition for each disk that is almost (>90%) full
Hardware
- fan_check.py checks the fans of a node using IPMItool
- networkbond_check.py monitors if a network bond (if there is one) has both (or more) interfaces properly active
- psu_check.py checks the power redundancy of a node using IPMItool
- raid_check.py checks whether all configured RAID devices are still healthy
Bandwidth Test
- networkperformance.py tests bandwidth between storage nodes, volume drivers and itself
OpenvStorage
- ovs_healthcheck.py calls the standard Open vStorage health checks, see: https://github.com/openvstorage/openvstorage-health-check
OVS Services
- ovsstatus.py checks every predefined period (default 60 seconds) if all OVS processes are still run
Deployment Test
- deployment_test.py tests every predefined period (default 30 minutes) whether test VM exists and if exists it tests write speed. Every 24hrs, test VM is recreated
Network
- publicipswatcher.py checks the status of the available public IPs
- routeros_check.py checks the status of RouterOS. (scheduled by routeros_check_schedule.py)
Redis
- redis_usage_check.py checks Redis server status
Stack Status
- nodestatus.py checks the status of each stack (CPU node)
Temperature
- temp_check.py checks the CPU + disk temperature of the system
Workers
- workerstatus_check.py monitors the workers, checking if they report back on regular basis report to their agent for new tasks